Cities Where Incomes Have Struggled to Keep Pace With Inflation
Jump to
The U.S. economy is now a full year into a historic run of inflation. Year-over-year price increases in the Consumer Price Index have topped 5% in every month since May 2021, peaking at 8.5% in March. While the Federal Reserve has begun to raise interest rates to cool the economy, supply chain challenges and strong consumer demand throughout the pandemic have sent inflation to its highest levels in four decades.
While countless headlines over the last year have invoked widespread concerns about inflation, not every household experiences rising prices in the same way. For example, homeowners who bought before the pandemic have been spared from spiking prices for housing costs, while remote workers have been less susceptible to rising costs for vehicles and gasoline. And amid a tight labor market and the Great Resignation, many workers have seen their wage gains outpace the rate of inflation—but for those who haven’t, rising prices have effectively given them a pay cut.
Even before the current run of inflation, many workers were already in a challenging position due to relatively slow wage growth relative to prices over the last decade. Average hourly earnings showed year-over-year growth of between 2% and 3% for most of the decade before the pandemic, falling behind the rate of growth in the CPI at several points. And over this period, higher earners—who may already be better equipped to withstand rising prices—saw their wages grow significantly faster than lower earners.
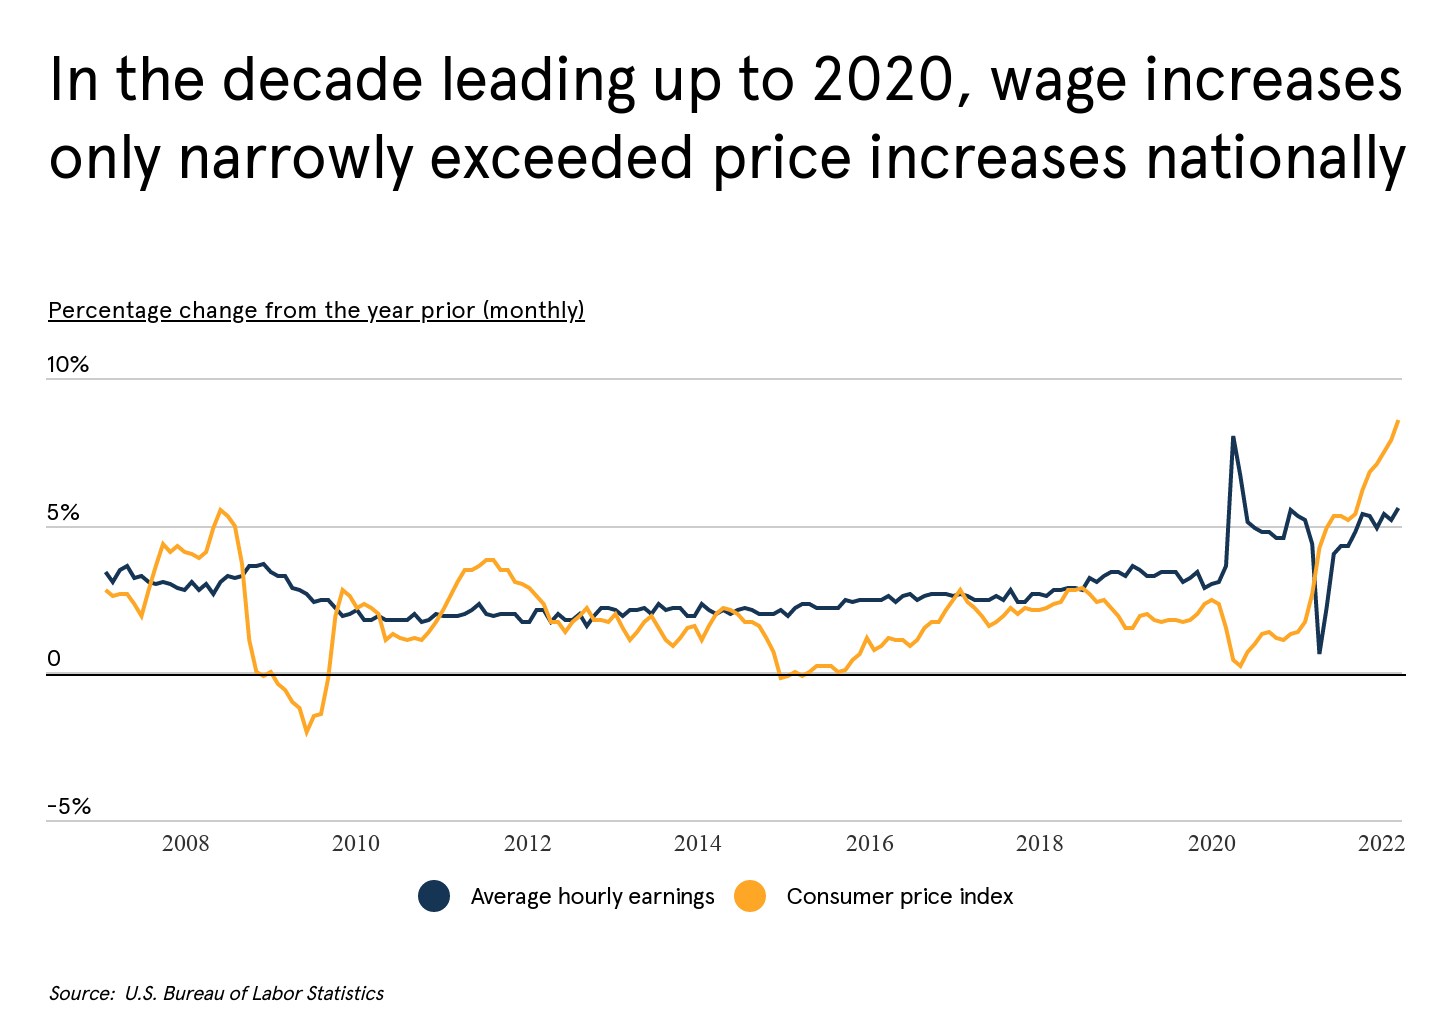
The pandemic and rising prices over the last year have changed this picture. Early in the pandemic, year-over-year wage growth spiked to more than 7.5% and has stayed around 5% for most of the last two years, nearly twice the rate of growth over the previous decade. This was good news for workers initially, as wage growth far exceeded the rate of inflation. But with prices rising rapidly, data from March 2022 year-over-year changes in the CPI are outpacing year-over-year changes in hourly earnings by 3 percentage points.
Changes in cost of living have also affected workers differently according to geography. More than two-thirds of states saw cost of living decrease relative to the national average in the decade before the pandemic. In contrast, coastal states like Washington, Oregon, and Massachusetts led the nation in cost of living increases over the same span.
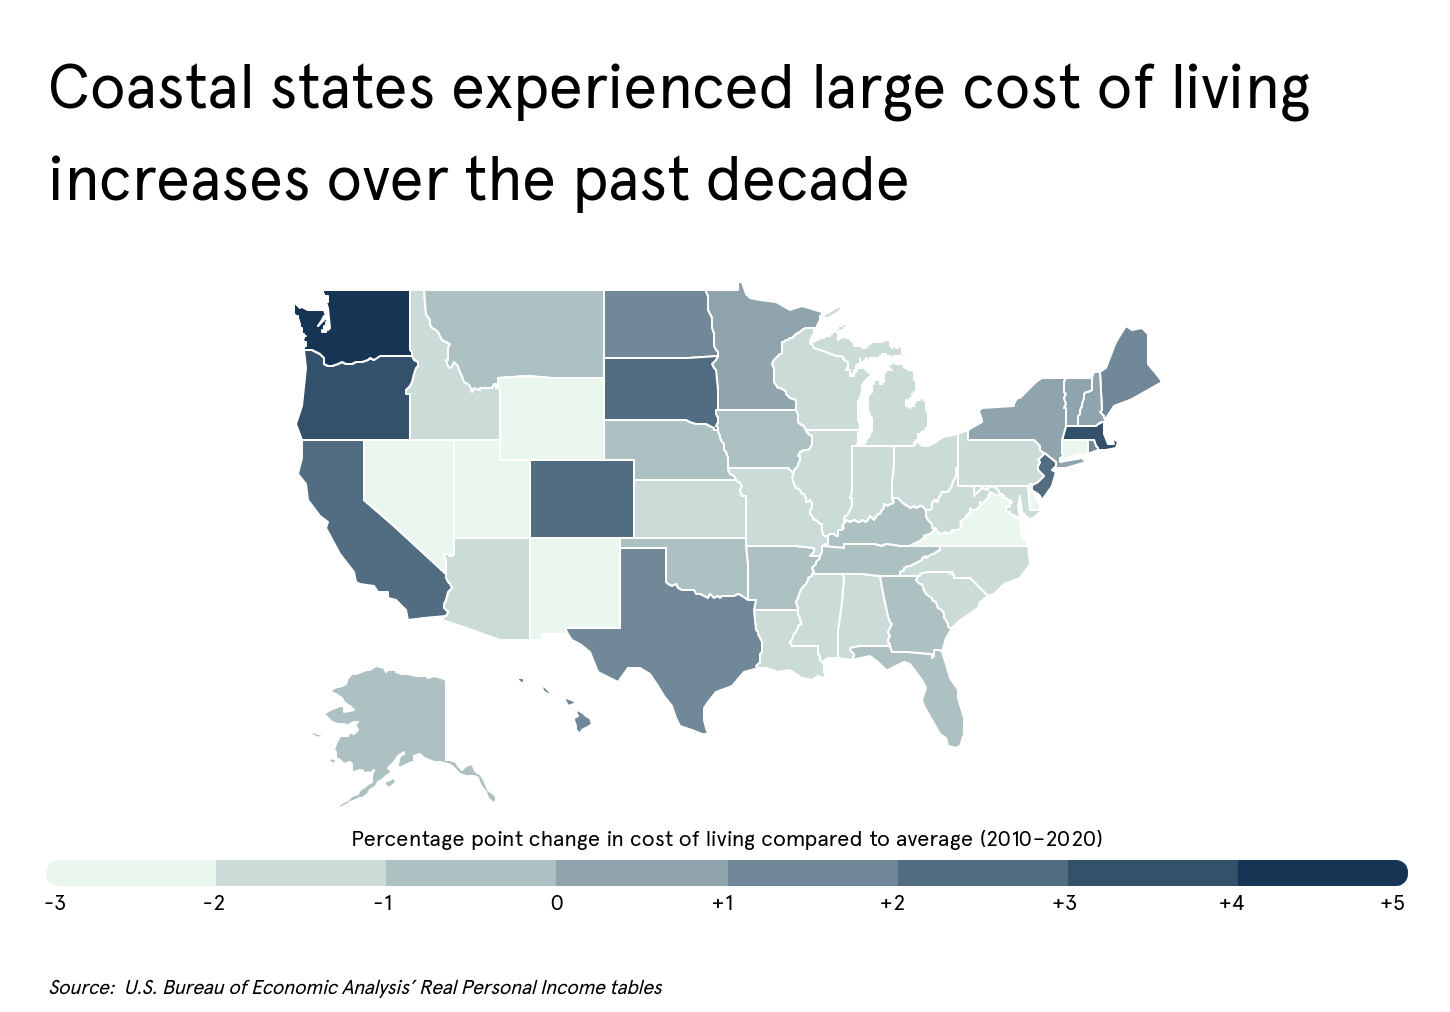
But with wage growth in mind, rising cost of living hasn’t necessarily reduced real income for the typical worker in more expensive states. Many of the states that had faster growth in cost of living, like California and Colorado, also have experienced economic prosperity that increased wages more rapidly than in other parts of the country.
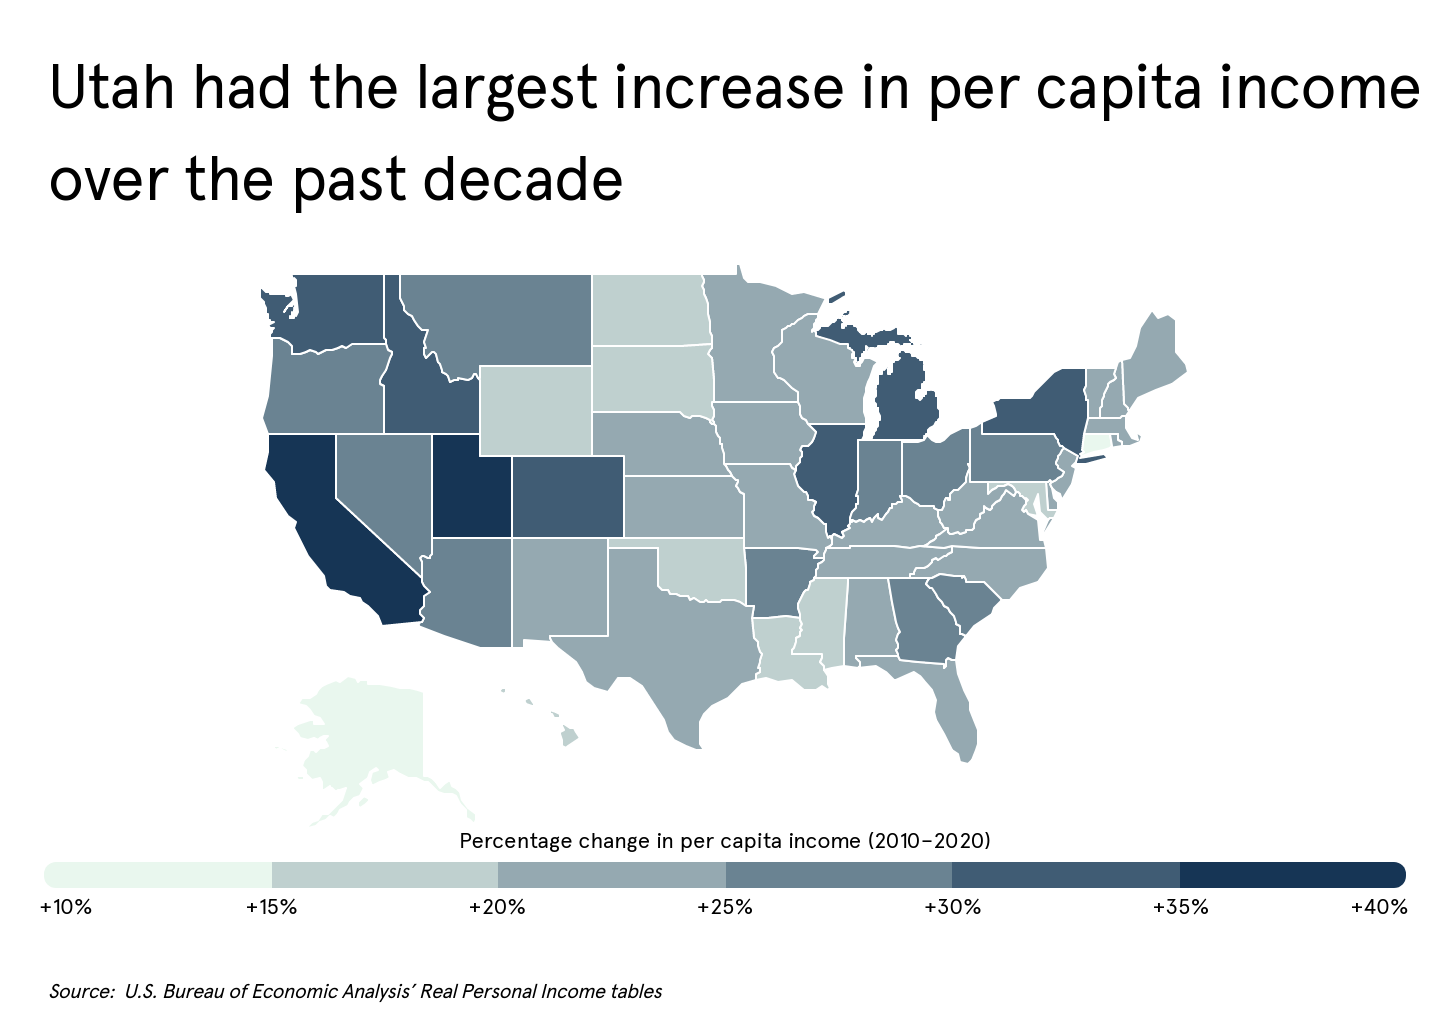
The state whose workers might be best off in recent years is Utah, which saw the nation’s fastest growth in real per capita income from 2010 to 2020 at 43.1% and had the seventh-lowest change in cost of living over that span.
At both the state and metro level, other locations have struggled with the opposite problem: slower increases in income alongside faster increases in cost of living. States where incomes have increased most slowly over the last decade include Alaska, Connecticut, Oklahoma, and Louisiana.
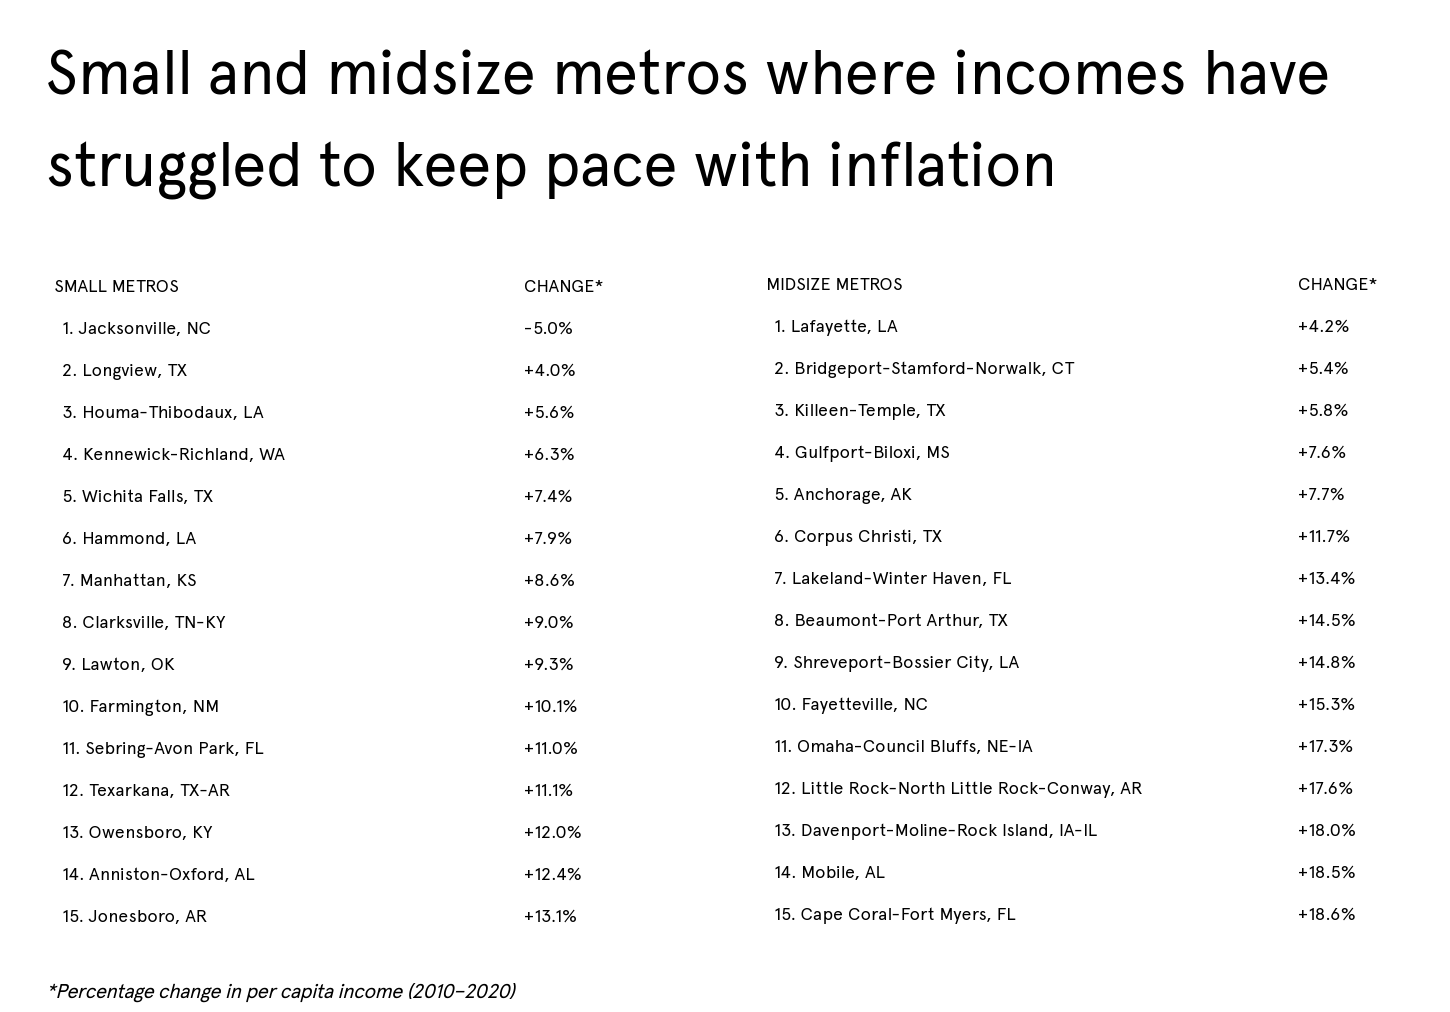
The data used in this analysis is from the U.S. Bureau of Economic Analysis’ Real Personal Income tables. To determine the locations where incomes have struggled to keep pace with inflation, researchers at LLC.org calculated the percentage change in real per capita income between 2010 and 2020, with lower values being ranked higher. All values shown are inflation-adjusted to 2020 dollars. To improve relevance, only metropolitan areas with at least 100,000 residents were included. Additionally, metros were grouped into cohorts based on population size.
Here are the U.S. metropolitan areas where incomes have struggled to keep pace with inflation.
Large metros where incomes have struggled to keep pace with inflation

15
Dallas-Fort Worth-Arlington, TX
- Percentage change in per capita income (2010–2020): +22.7%
- Total change in per capita income (2010–2020): +$10,888
- 2020 per capita income: $58,828
- 2010 per capita income: $47,940

14
Memphis, TN-MS-AR
- Percentage change in per capita income (2010–2020): +22.5%
- Total change in per capita income (2010–2020): +$10,161
- 2020 per capita income: $55,398
- 2010 per capita income: $45,237

13
Boston-Cambridge-Newton, MA-NH
- Percentage change in per capita income (2010–2020): +22.4%
- Total change in per capita income (2010–2020): +$14,273
- 2020 per capita income: $78,095
- 2010 per capita income: $63,822

12
Kansas City, MO-KS
- Percentage change in per capita income (2010–2020): +22.4%
- Total change in per capita income (2010–2020): +$11,249
- 2020 per capita income: $61,555
- 2010 per capita income: $50,306
11
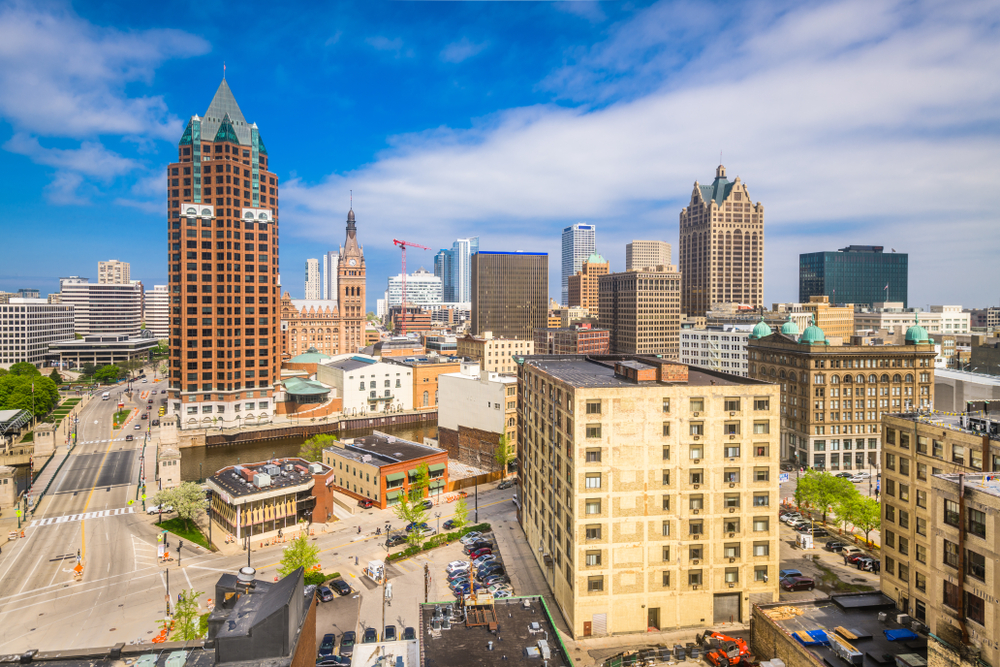
Milwaukee-Waukesha, WI
- Percentage change in per capita income (2010–2020): +21.6%
- Total change in per capita income (2010–2020): +$11,232
- 2020 per capita income: $63,321
- 2010 per capita income: $52,089

10
Tulsa, OK
- Percentage change in per capita income (2010–2020): +20.4%
- Total change in per capita income (2010–2020): +$10,630
- 2020 per capita income: $62,762
- 2010 per capita income: $52,132

9
Virginia Beach-Norfolk-Newport News, VA-NC
- Percentage change in per capita income (2010–2020): +19.8%
- Total change in per capita income (2010–2020): +$9,210
- 2020 per capita income: $55,652
- 2010 per capita income: $46,442

8
Baltimore-Columbia-Towson, MD
- Percentage change in per capita income (2010–2020): +19.7%
- Total change in per capita income (2010–2020): +$10,464
- 2020 per capita income: $63,531
- 2010 per capita income: $53,067

7
Tampa-St. Petersburg-Clearwater, FL
- Percentage change in per capita income (2010–2020): +19.3%
- Total change in per capita income (2010–2020): +$8,574
- 2020 per capita income: $52,981
- 2010 per capita income: $44,407

6
New Orleans-Metairie, LA
- Percentage change in per capita income (2010–2020): +17.9%
- Total change in per capita income (2010–2020): +$9,105
- 2020 per capita income: $60,012
- 2010 per capita income: $50,908

5
Oklahoma City, OK
- Percentage change in per capita income (2010–2020): +16.6%
- Total change in per capita income (2010–2020): +$8,014
- 2020 per capita income: $56,419
- 2010 per capita income: $48,405
4
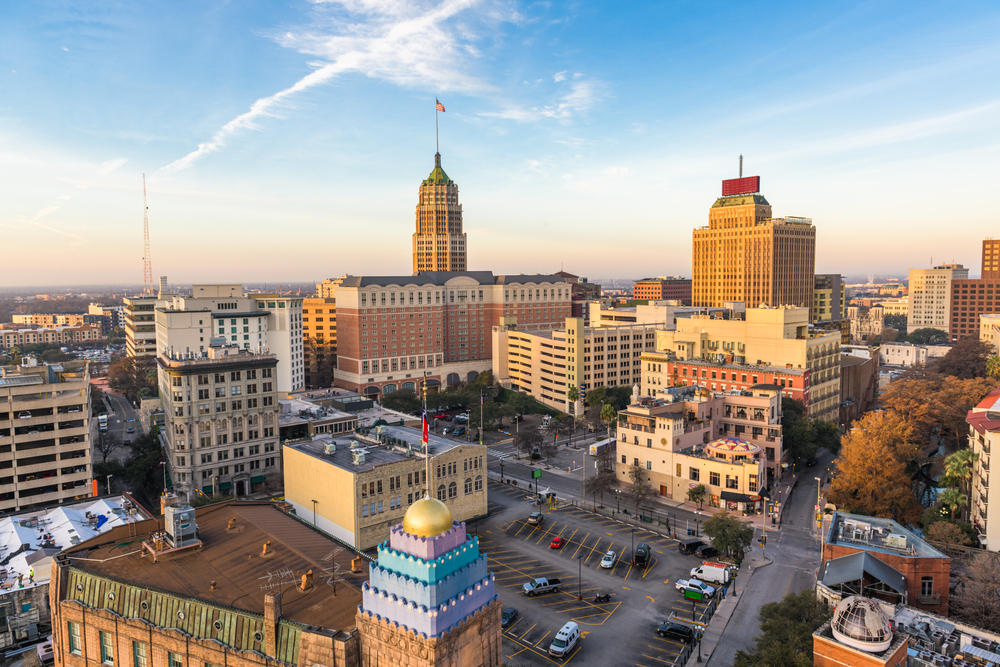
San Antonio-New Braunfels, TX
- Percentage change in per capita income (2010–2020): +16.6%
- Total change in per capita income (2010–2020): +$7,286
- 2020 per capita income: $51,295
- 2010 per capita income: $44,009

3
Washington-Arlington-Alexandria, DC-VA-MD-WV
- Percentage change in per capita income (2010–2020): +15.6%
- Total change in per capita income (2010–2020): +$9,348
- 2020 per capita income: $69,115
- 2010 per capita income: $59,766

2
Hartford-East Hartford-Middletown, CT
- Percentage change in per capita income (2010–2020): +14.9%
- Total change in per capita income (2010–2020): +$8,523
- 2020 per capita income: $65,724
- 2010 per capita income: $57,201

1
Houston-The Woodlands-Sugar Land, TX
- Percentage change in per capita income (2010–2020): +14.1%
- Total change in per capita income (2010–2020): +$7,417
- 2020 per capita income: $60,092
- 2010 per capita income: $52,675
Detailed findings & methodology
The data used in this analysis is from the U.S. Bureau of Economic Analysis’ Real Personal Income tables. To determine the locations where incomes have struggled to keep pace with inflation, researchers calculated the percentage change in per capita income between 2010 and 2020, with lower values being ranked higher. In the event of a tie, the location with the smaller total change in per capita income over the same time period was ranked higher. Note all values shown are inflation-adjusted to 2020 dollars. To improve relevance, only metropolitan areas with at least 100,000 residents were included. Additionally, metros were grouped into cohorts based on population size: small (100,000–349,999), midsize (350,000–999,999), and large (1,000,000 or more).
Find out how to start an LLC in your state
Click on the state below to get started